A social listening analysis of the Food & Beverage sector
The last few years have seen a focus on the role business plays in society. This has been exacerbated by the coronavirus (COVID-19) pandemic and the Black Lives Matter movement. There is a sort of awakening, people seem to be leaving behind their role of spectators to assume that of activists.
This pressure comes not only from traditional players, but from other stakeholder groups. Companies are now being held accountable to their employees, local communities, and the public in general. Employees and customers will likely protest, increasingly loudly, if a company’s words are not supported by actions.
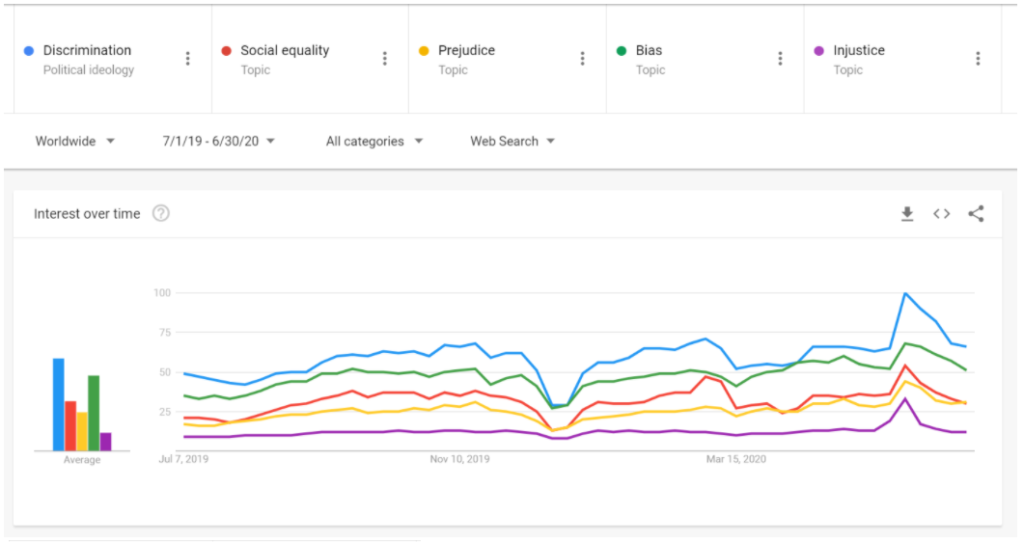
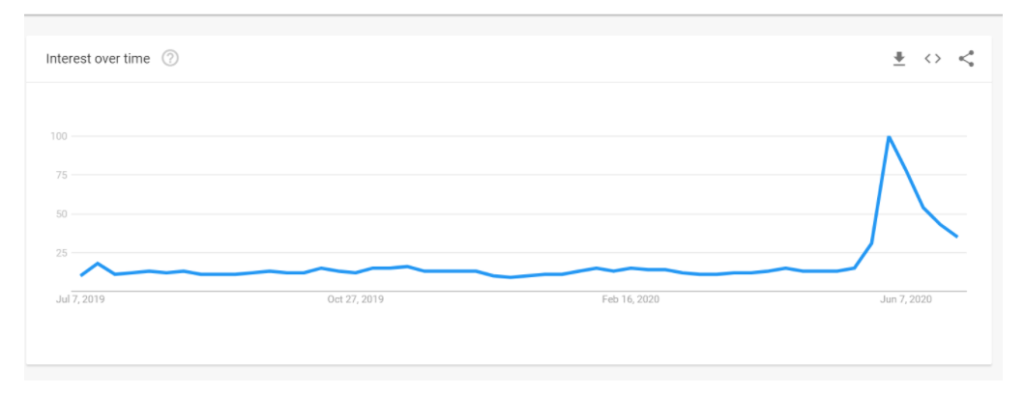
Such protests are especially evident online. For instance, a simple Google Trends analysis shows clear spikes in search volumes of key social terms connected to the Black Lives Matter movement (Racism, Social equality, Prejudice, Bias, Injustice) in late May, early June worldwide (Figure A & B).
As now the public shifts its gaze toward social issues, how can we see this shift taking place on the public online perceptions of specific industries’ (and, down the line, companies’) ESG practices and initiatives?
To gain insight into this, we examined the online public results across news and social media around the Food & Beverage industry over one year. The Food & Beverage sector provides an ideal test case as it has remained particularly active and relevant during the coronavirus pandemic.
Figure A:Google search popularity of terms connected to Black Lives Matter Movement Source: Google TrendsFigure B:Google search popularity of terms connected to Black Lives Matter Movement Source: Google Trends
How the public reacted to social and environmental matters during COVID-19 crisis
Details of the methodology we used
Small-scale social listening analysis on the Food & Beverage sector based on PwC Digital Intelligence Services. We collected a dataset of over 2.5 million data points from public tweets, forum posts, and online news articles related to the Food & Beverage sector (1), from July 1, 2019 to June 30, 2020.
The next step was filtering and segmenting the dataset into three topical areas: Environment, Social, Governance and 8 sub-topics: Climate Action & Emission (E), Resource Use & Depletion (E), Waste & Pollution (E), Human Rights & Abuse (S), Equality & Discrimination (S), Community & Land Use (S), Business Ethics (G), and Transparency & Reporting (G) (2). The resulting dataset was composed of 450,000 ESG-related Food & Beverage results. We constructed all queries and filters in English, using English keywords and terminology. However, the results were not restricted in terms of origin countries.
In the last months social issues have taken central stage in the industry
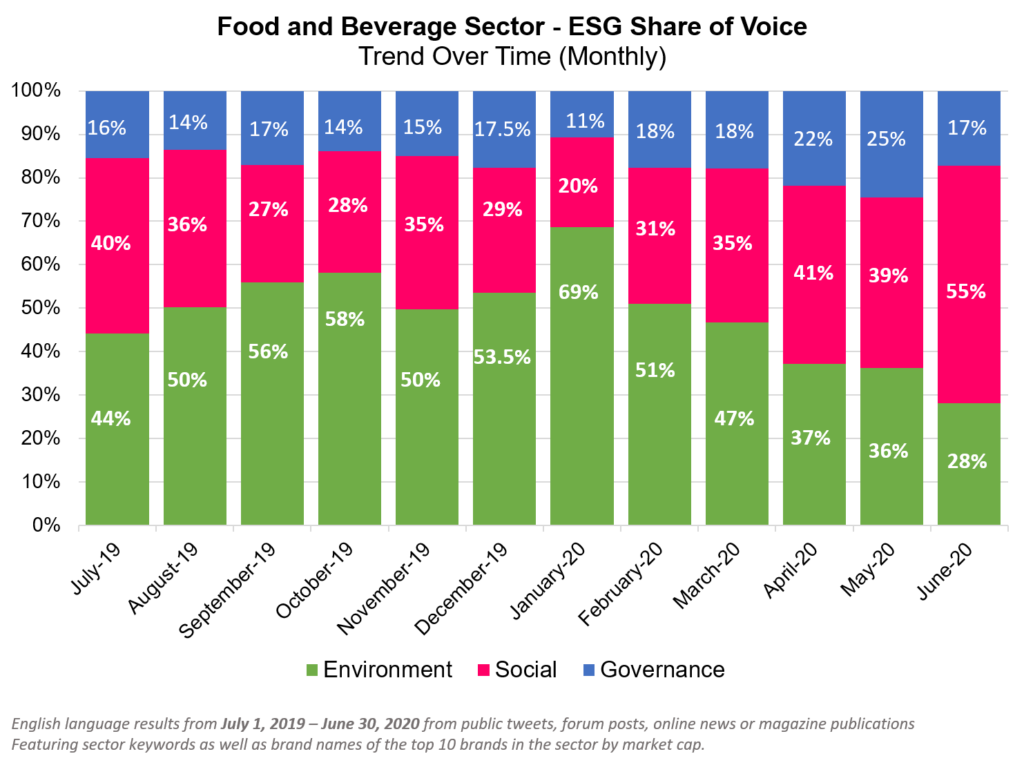
In Figure C, we see that environmental topics make up a majority of the ESG online conversations occurring around the Food & Beverage sector and related companies for the first nine months of the studied period. However, from February, we see a shift starting to take place, with environmental discussions showing a decreasing share of voice and social topics increasing. This increase in social share of voice reaches its highest in June comprising 55% of the Food & Beverage ESG online mentions.
Figure C: Food and Beverage sector – ESG Share of Voice
Equality-related matters were the trigger
Zooming into this time period (late March – June), we then break down the topics into the component subtopics to see the drivers behind this increase (Figure D). In March – mid May, there are variable increases week to week in both Human Rights & Abuse’s and Equality & Discrimination’s share of the discussion. They were triggered by issues related to McDonalds in China and US as well as articles relating to the pandemic and grocery store/meat plant workers.
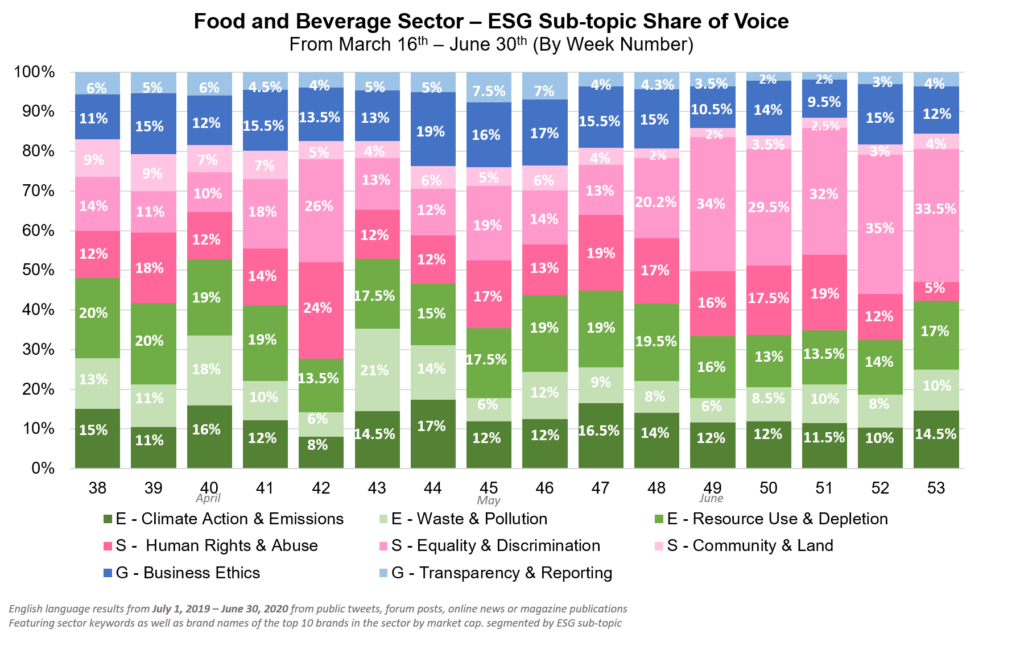
Figure D: Food and Beverage sector – ESG Subtopic Share of Voice
Starting in late May (Week 48 of our data sample), we see a spike in Equality & Discrimination discussions around the Food & Beverage sector, coinciding with the Black Lives Matter protests. In June, over 76% of the Equality & Discrimination mentions for the Food & Beverage sector were in some way related to race and/or racial discrimination (6).
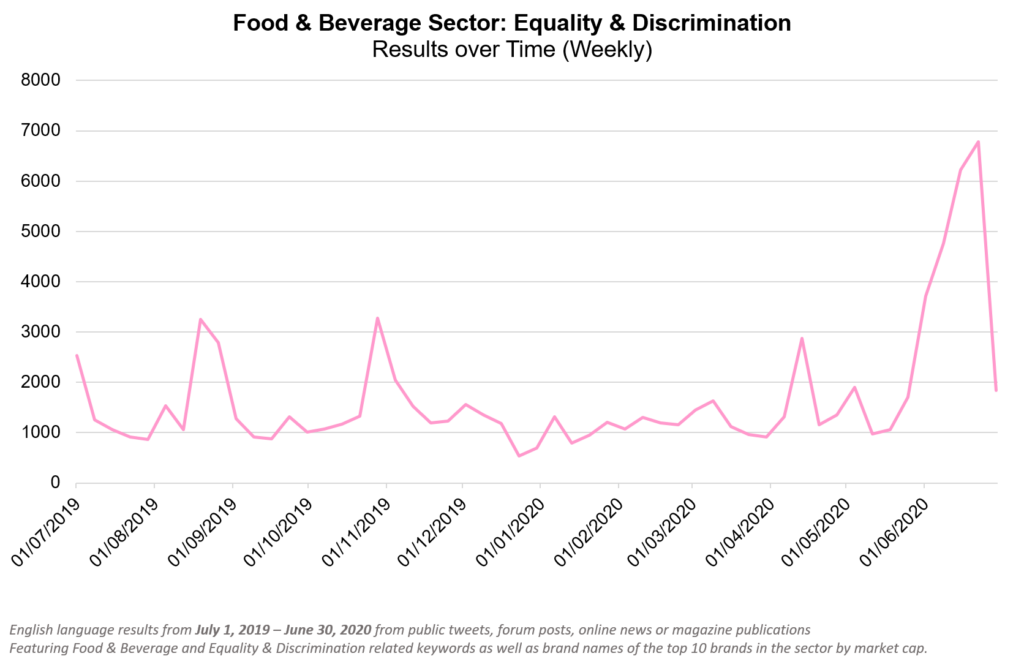
As awareness grew around social and racial prejudice embedded in the justice system, it also raised awareness and scrutiny of the social practices of other sectors beyond policing. This can clearly be seen in the 293% increase in Equality & Discrimination-related mentions in the Food & Beverage sector from May to June (Figure E).
Figure E: Food and Beverage Sector: Equality & Discrimination results over time
How businesses reacted to social and environmental matters during COVID-19 crisis
Details of the methodology we used
To get a small glimpse into how Food & Beverage businesses are responding during this time, we collected all English Tweets from the official accounts of three top Food & Beverage companies across North America and Europe from January 2020 – June 2020. We then applied the same ESG topical filters (English keywords only) to the results. For this time period, accounts across the three companies tweeted (original, non-retweets or replies) 1,411 times combined, 53% of which was directly connected to ESG topics.
At company level social issues also were in the spotlight but for a shorter time
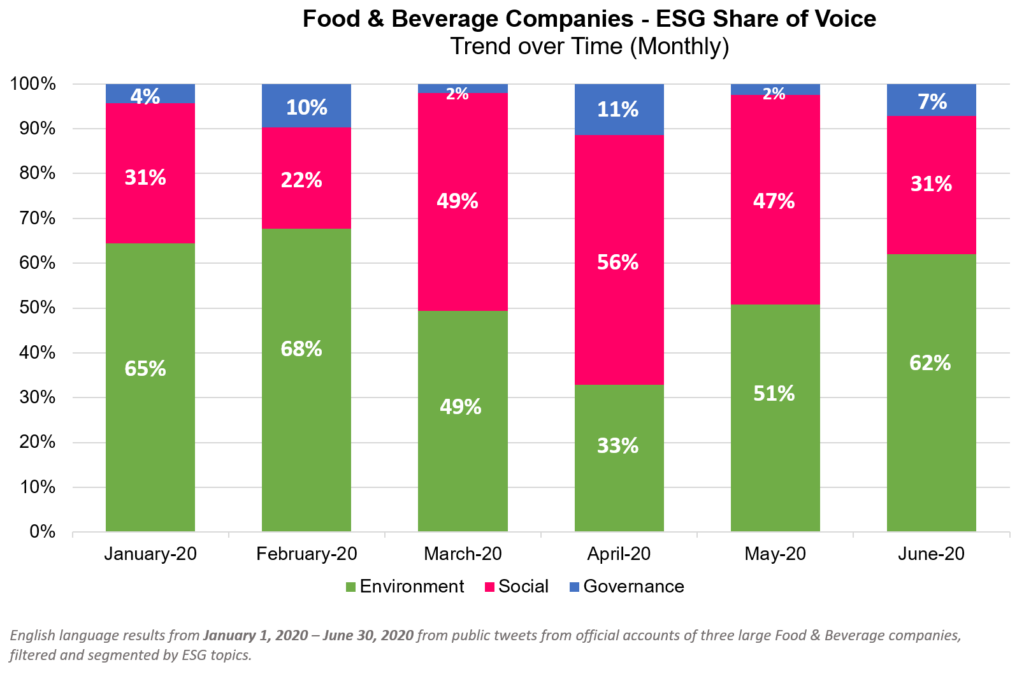
In Figure G, we see that, for the companies’ official communications, Social topics have a spike in share of voice between March and April. Then, in both May and June, there is a shift back to majority Environmental topics (51% in May, 62% in June). This does not mirror the pattern of the Sector data, in which Social mentions grow slightly from March to May but peak in June.
Figure G: Food and Beverage companies (sample) – ESG Share of Voice over time
Equality & Discrimination results included more than race-related social matters
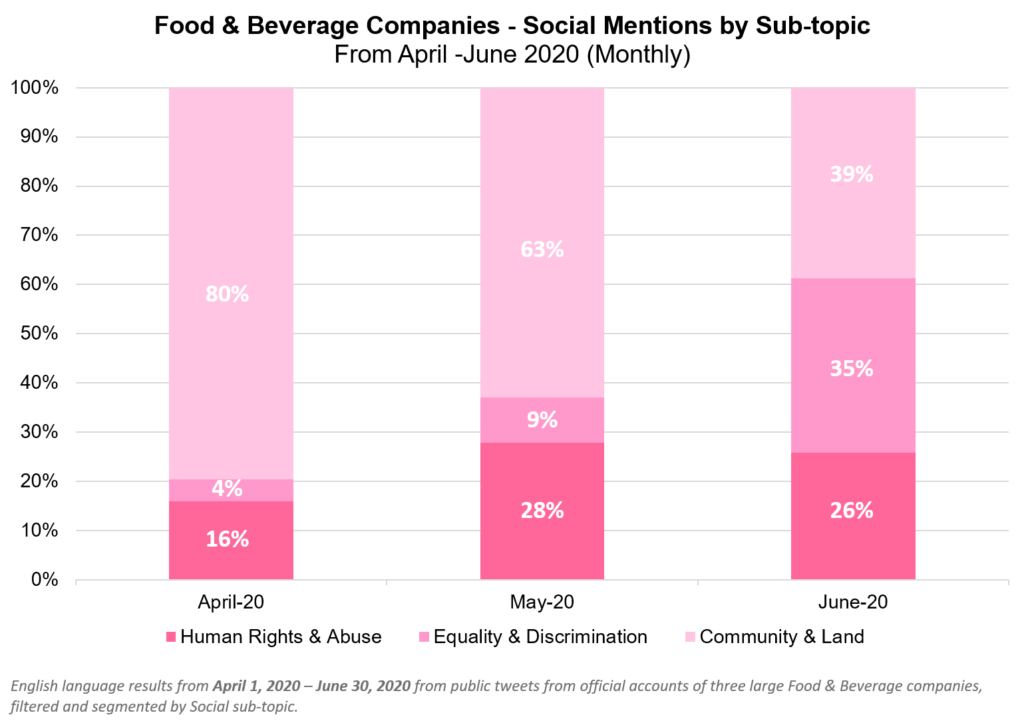
When breaking down the social mentions of the companies again by subtopic for April – June (Figure H), we see that the social share of voice increase appears to be due to Communities & Land related mentions, specifically communications regarding the companies’ COVID-19 initiatives and donations for vulnerable communities and healthcare workers. In June, Equality & Discrimination does show a larger share of voice across the three companies.
Nonetheless, digging into these Equality & Discrimination results, only 36% of the results directly mention race, racism, or related initiatives (originating from two of the three brands only). The rest of the Equality & Discrimination results are related to LGBT/Pride Month, Women’s Rights and Diversity in general.
Figure H: Food and Beverage companies (sample) – Social subtopics Share of Voice
Which conclusions can be drawn from this research?
In this small study, we see that overall the Food & Beverage sector has been largely impacted by the trending social topics both in response to the coronavirus pandemic and to a larger extent the Black Lives Matter movement.
In contrast, in the three Food & Beverage companies’ official Tweets, we only see a shift in response to the coronavirus pandemic, but do not (yet) see a change in corporate communications in response to the increased racial justice discussions.Nevertheless, the commercial and reputational incentives for companies to stay ahead of the game regarding ESG are increasingly clear.
And it is the ‘S’ which can make such a difference to trust, inclusion, reputation, and engagement.
This analysis showcases how social media and public web data can be analysed to understand current trends in real time and how such insights can be used by management to inform decision making and strategy going forward and measure progress on the ESG roadmap.
In particular, when combined with topics such as sustainability and ESG, social analytics can function as a type of materiality assessment in terms of which issues are most important to consumers and society and guide brands in improving their reputation, increasing loyalty and ultimate commercial success.
What we think
Christine Lugrine, Data Analytics Senior Advisor in Technology/Digital Services at PwC Luxembourg
Social and web analytics in terms of CSR/ESG can be used as a force for good for brands to better understand their CSR reputations and how they can better align their strategies and initiatives with the issues that are not only important to customers but better for the community and the planet as well.
Benedikt Jonas, Director at PwC Luxembourg
If you can’t measure your ESG perception with society, you can’t improve it.
Footnotes
(1) The food and beverage related results were identified via a keyword query featuring generic keywords (grocery stores, grocers, food and beverage industry, food and beverage companies) as well as brand names of the top 10 Food & Beverage companies globally by market cap.
(2)ESG topics and subtopics are constructed of English keywords and phrases using Boolean language. The names of the sub-topics describe the main topics of the queries but the queries are not limited to only those title keywords. For example, Climate Action & Emissions includes the keywords “climate action” and “emissions” as well as related keywords such as “climate change”, “greenhouse gases”, “global warming”, “Paris Agreement”, “carbon footprint”, etc.
(3) (racism OR racist OR racial OR “floyd” OR “black lives matter” OR “police brutality” OR “police violence” OR “police killing*” OR “#Blacklivesmatter” OR “BlackLivesMattters” OR “injustice black”~5 OR “injustice African American*”~5 OR “Black people” OR “Black American*” OR “African American*” OR “people of color” OR ++”BLM”)